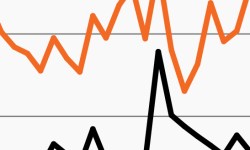
Stock and bond volatility jump together
Volatility has escalated this year across stock and bond markets. This week’s chart looks at daily changes in the S&P 500 and the Agg.

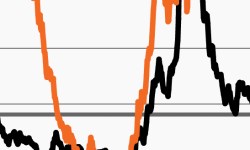
Treasury and equity volatility reach recent peaks
Markets have been choppy and there could be more to come. This week’s chart looks at recent rises in expected equity and Treasury volatility.
Real yields rise to usher in new market dynamics?
After two years in negative territory, real yields are back to zero. Our chart looks at real yields impact on growth and value stocks.

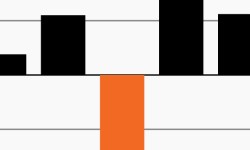
Already vulnerable, the 60/40 appears deeply challenged
The 60/40 had its worst quarter since the pandemic started. Our chart looks at quarterly returns and why the coming quarters could remain volatile.
Diverging economic forecasts as rate hikes begin?
The Fed liftoff took place as market drivers compete. This week’s chart looks at two as investors manage through an uncertain environment.
Inflation wreaks havoc on traditional assets
Amid another record CPI print, this week’s chart looks at the S&P 500 and the Agg’s historical returns during periods of elevated inflation.