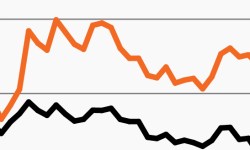
Tech-heavy market accentuates stocks’ rich valuations
Overconcentrated and expensive? This week’s chart looks at valuations on the top 10 S&P stocks vs. the full index.
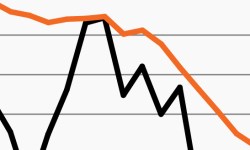
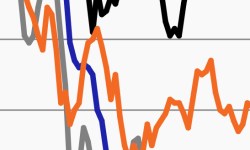
As growth turns higher, leading indicators remain flat
Markets have rallied amid better-than-expected economic data, but leading indicators show little optimism. This week’s chart looks at the growing gap.
Stock market concentration near a tipping point?
Concentration issues? This week’s chart looks at the top 10 stocks’ growing representation within the S&P 500.
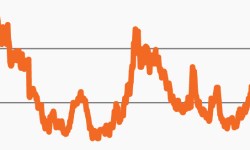
Credit attractive compared to expensive stocks?
Stocks remain expensive and credit markets may offer an attractive alternative. This week’s chart looks at diverging valuations over time.
Soft economic landing to challenge markets?
This week’s chart looks at recent forecasts for economic growth and inflation and why markets could be forced to muddle through a soft landing.

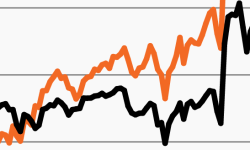
2023 has seen an extraordinarily concentrated rally
Stocks have rallied in 2023. But this week’s chart looks at the massive divide between returns on the Big 6 tech stocks and the rest of the S&P 500.