Family offices plan material increase to private markets
This week’s chart looks at family office CIOs’ plans to increase allocation to alts in 2024, specifically private credit and private equity.

The clear opportunity in a healthy middle market
Despite allocation challenges, revenue growth in the U.S. middle market remains healthier than ever as this week’s chart highlights.
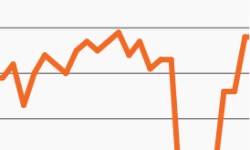
As yields decline, so does cash’s appeal
Money market assets keep growing despite yields declining. This week’s chart looks at the diverging trends as cash may be losing its luster.
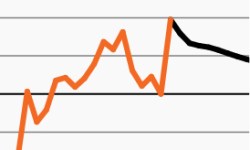
Cash attractiveness may have peaked in 2023
Cash was an attractive, safe asset last year amid elevated rates. This week’s chart looks at why the tide may be changing.
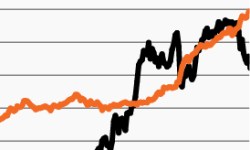
Will a rate-dependent equity market become a headwind?
Could last year’s market tailwind turn into this year’s headwind? This week’s chart looks at stocks and rates’ tandem moves over the past year.

Equity market to remain rate dependent in 2024?
This week’s chart finds the bulk of the S&P’s returns last year came on days when rates fell. So far, 2024 has followed a similar pattern.
