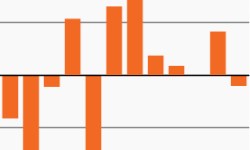
Small caps show signs of economic stress?
This week’s chart looks at the rising percentage of small cap companies reporting negative earnings as public index returns mostly remain in neutral.

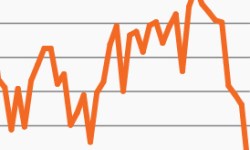
Inflation data drives market volatility
As the market remains focused on inflation, this week’s chart looks at S&P returns on days when CPI is released compared to non-release days.
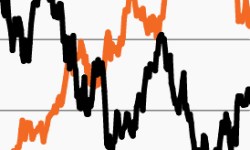
Sentiment and spending fight it out
Consumer sentiment and spending are telling two different stories, which could lead to differing economic outlooks.

Yield reversal could complicate the Fed’s job
This week’s chart looks at financial conditions, which could undermine the Fed’s attempt to ready markets for a higher-for-longer environment.
Strong dollar costs stocks
This week’s chart looks at how recent dollar strength could test an already-challenged equity market.
A focus on duration amid the nonstop rise in rates
This week’s chart looks at high yield bonds’ limited duration profile compared to investment grade bonds.
